![]()
Unlocking Adoption Through Structural UX Changes
Problem
Inherited a complex interface that served multiple user types poorly, creating confusion and inefficient workflows.
Goal
Resolve structural and usability problems, ship improvements without stalling an active build.
Role
Senior designer leading end-to-end redesign — partnering with 2 PMs and 2 engineering teams.
The Starting Point
RZero is a startup offering occupancy and environmental sensors that help enterprise customers manage and strategize their office space utilization. The platform captures real-time occupancy, temperature, and air quality data across a customer’s building portfolio.
When I joined, a new platform was already mid-build. I had to assess what existed, identify what was broken, and support an active engineering process at the same time as redesigning it. That condition shaped every decision I made: everything had to be practical, fast, and implementable without derailing a build already in motion.
The engagement data made the problem concrete:
| Metric | Baseline |
| Customers using the UI only to download data | 52% |
| Features actively used | 33% |
| Real-time dashboard visits | Least visited feature |
The platform had real data value — but more than half of customers were bypassing the analytics experience entirely. Users just couldn’t access it. View the inherited interface →
Discovery
My initial goal was to find the root cause behind what I was seeing in the UI and learning from the data. I asked to be included in weekly customer success calls across different customer industries — corporate, medical, and others — to get direct access to user feedback rather than filtered summaries. When hearing feature requests, I drove the conversation toward root causes: where users hesitated, what they exported, and what workarounds they’d built for themselves.
Questions I asked during these calls:
What prompts you to log in? What question are you trying to answer?
How do you currently make decisions about space reallocation?
If you could instantly see which conference rooms were underutilized in the past 90 days, what would you do with that?
The behavioral pattern became clear. Some users logged in daily to check real-time occupancy and weekly to analyze trends. Others logged in once or twice a week to check on devices and troubleshoot sensor issues. They were doing completely different jobs in the same interface.
Using AI to Synthesize Retroactive User Feedback
To validate this and understand the scale of each problem, I used Grok to query a year of sales and customer success call transcripts. I asked it to surface how different users responded when devices went offline — whether they were concerned about data accuracy or about fixing the hardware. The results confirmed what I was seeing on calls: analytics users had no interest in troubleshooting.
Their only concern was whether offline devices were skewing the numbers they relied on. Admin users were the ones actually diagnosing and fixing things. The data helped me rank which problems were significant versus incidental, and gave me the evidence to recommend prioritization to the PM.
The Structural Fix
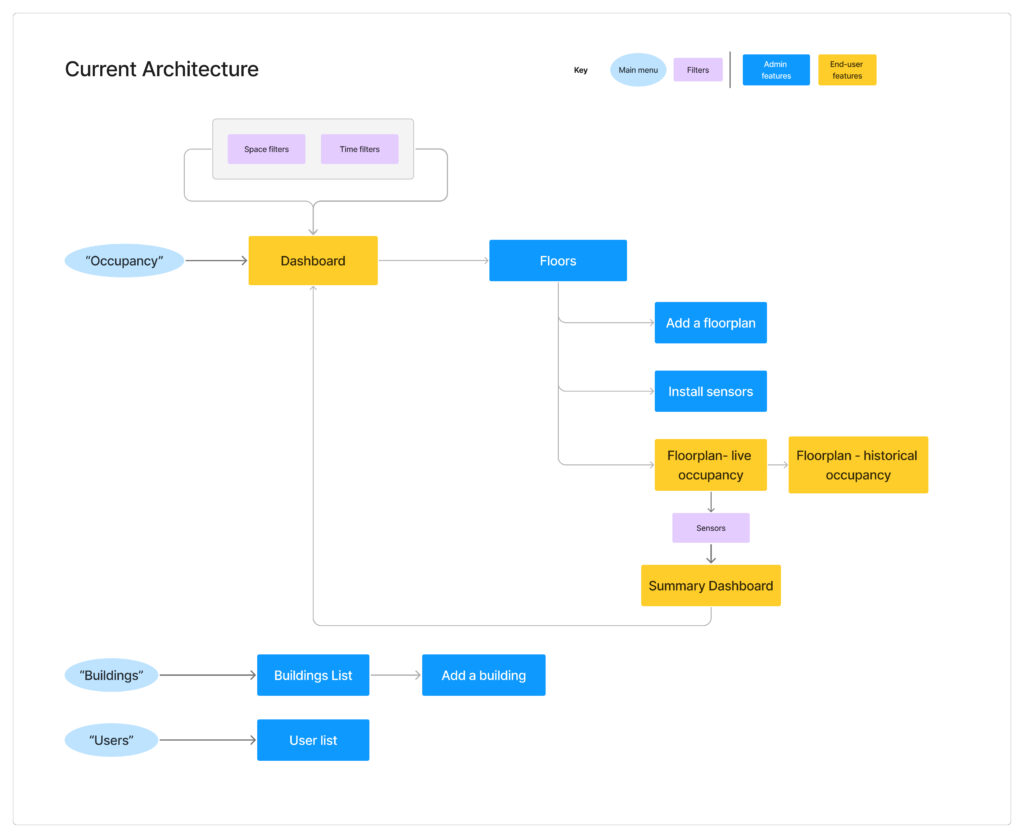
The most visible symptom of the underlying IA problem was the real-time floor map. It displayed both device types — motion sensor, desk sensor, room sensor — and occupancy status simultaneously. The legend had over ten items. Neither user type could quickly extract what they needed: admins couldn’t identify which sensor types were offline, and workplace managers couldn’t see which spaces were available.
But the floor map was a symptom, not the problem. The platform was forcing two users with incompatible mental models to share one interface. Admins think in terms of devices, connectivity, and system health. Workplace managers think in terms of spaces, availability, and utilization trends. The interface had grown to accommodate both, and in doing so, served neither.
Information architecture diagram (before and after): the platform was forcing two users with incompatible mental models to share one interface. The yellow box represent analytic user actions, and blue the admin user.
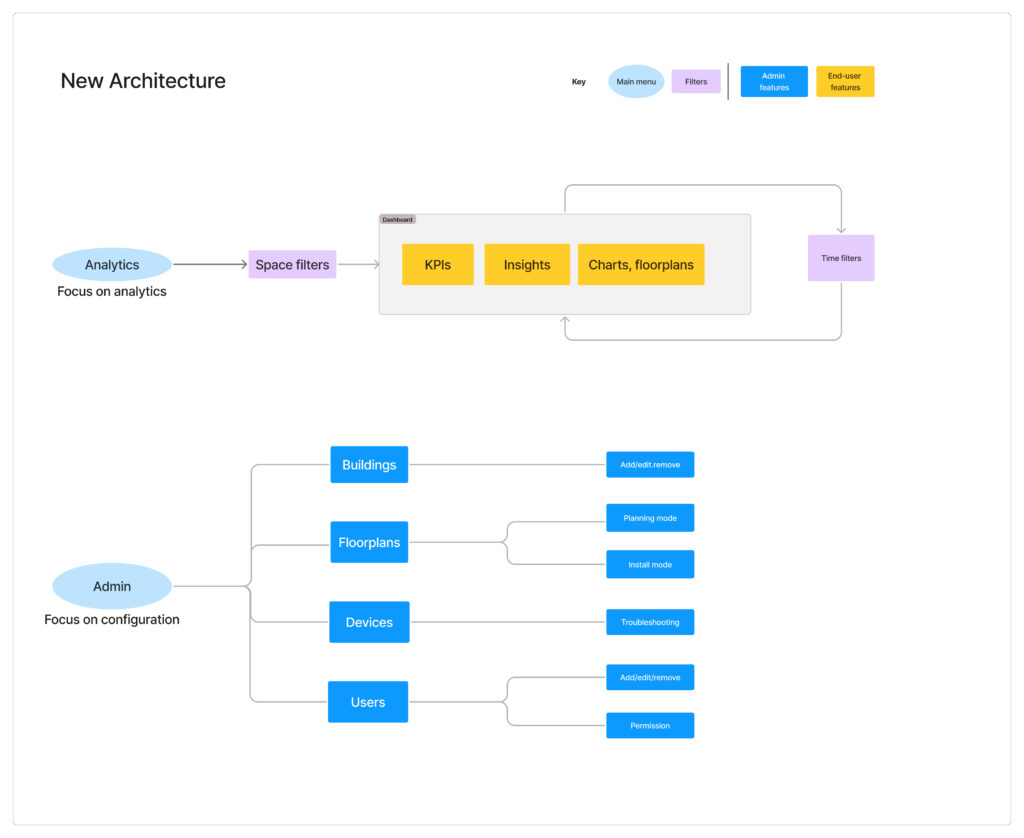
I suggested a phased approach.
Phase 1 — Navigation layer.
Phase 1 will focus on the lowest-effort intervention with the clearest payoff: restructure the navigation to give each user type a direct path to what they needed. Admin functions on one side, analytics on the other.
Main Navigation Solution.
Updating the navigation restructure to allow a clean path for each user-type.


Phase 2 — Dedicated admin portal.
As operational needs grew — installers needed provisioning tools, remote support engineers needed spatial troubleshooting views, the business needed to scale to new sensor types — engineering and I agreed, as a collaborative effort, that building those features into the analytics app would slow development and clutter the experience for analytics users.
Together we decided to build a separate admin portal, launching internally first to move fast, with the plan to release to admin customers later. The analytics app benefited immediately: without admin features competing for space, the experience became focused and clean. The admin portal has its own navigation structure built around operational workflows rather than analytics.
Analytics vs Configuration. A focused experience for each user-type.


From Cluttered to Clear
With the structural issue improving, I turned to the usability problems keeping engagement low. Three areas needed direct attention.
Filter Redesign
The analytics filter exposed the full admin tag taxonomy — a flat, multi-column list of every possible tag combination — directly to analytics users who simply needed to filter by department or space type. With no hierarchy and no visual guidance, most users gave up.
I replaced it with a hierarchical filter: sequential inputs that let users choose a category first, then values within it, with full flexibility to layer additional categories as needed.

Floor Map and Legend
Once the experiences were separated, each map could be optimized for its user. The analytics map dropped device type entirely — something workplace managers never needed to know — and shows occupancy status only: available and occupied, with a recency indicator.

Dashboard Data Visualization — Color and Accessibility
The inherited dashboard had accumulated chart colors with no consistent logic — multiple hues with no relationship to the design system or to data meaning. I consolidated to a single primary color drawn from the updated data color library (more on the design system colors below), used consistently across all charts. Patterns became readable. The visual noise that had been competing for attention was gone.
Beyond color, I reorganized the chart sequence to follow the natural arc of how workplace managers think about their data: starting with average versus peak utilization, then breaking it down by day of week, then by hour, then comparing across space types, and finally drilling into conference room occupancy specifically. Each chart answers the next logical question a user has after seeing the previous one. The sequence tells a story rather than presenting a list of metrics.

Design System and Components
Supporting Implementation Velocity
When I joined, the engineering teams had no prior design system guidance and were using SHADCN — a component library built on Radix UI and Tailwind. Without additional resources to count on, I built a Figma component library mapped directly to what they were already using: same component names, matching variants, same structural logic. Rather than designing custom components they’d have to rebuild from scratch, the design and the code referred to the same things. There was no translation gap between what I handed off and what got built. Visual consistency across both products came within three to four sprints, and the library became the standard for all future feature development.
Components. The Figma checkbox component and its variants (left) mapped directly to the day-of-week filter in the product (right).

Live Collaboration During Development
I ran daily open office hours for both engineering teams. Developers could drop in, share their screen, and work through implementation questions in real time. I made a point of explaining the reasoning behind decisions, not just the outcomes — why a sensor icon needed to animate on the map (an admin troubleshooting in the field needs to spot one device among hundreds instantly), why hover states mattered on interactive elements (without them, users have no signal that something is clickable). Over time, engineers started coming to me with better-framed problems because they understood what users needed. It changed how the team thought, not just what they built.
Results
Within 12 months, all enterprise customers were successfully migrated to the new platform. Internal teams gained a dedicated admin portal that let them support customers faster — reducing support resolution time by 25%. The portal was also ready to be exposed to the first external customers for user management and permissions.
| Metric | Before | After |
| Customers using UI to download data only | 52% | Under 10% |
| Features actively used | 33% | 76% |
| Weekly platform visits | — | +40% |
| Real-time dashboard | Least visited | Most visited |
Customer success reps reported:
“For the first time, customers are asking us how to integrate the floor plan view into their office kiosks. They want to replace traditional wayfinding with our real-time occupancy data.”
The project received a company-wide Kudo specifically for improving customer perception of the platform’s capability.
Key Learnings
Work with what’s already moving. Joining mid-build could have been a constraint. Mapping directly to the engineering team’s existing component library, rather than designing something new, turned it into an advantage — faster implementation, zero design debt at launch, and a shared language between design and code that made ongoing collaboration more productive.
Phasing is a strategy, not a compromise. Starting with the navigation restructure before building the full admin portal let us validate the separation direction quickly and cheaply. Each phase generated the evidence that justified the next investment — rather than committing upfront to a large architectural change based on assumptions alone.
AI accelerates the process — but only if you direct it precisely. Using AI to synthesize a year of call transcripts compressed weeks of analysis into hours. But the quality of what came back depended entirely on how well I framed the query — including the objective, the user context, and the constraints I was working within. AI is a force multiplier for a designer who knows what they’re looking for. It doesn’t replace the judgment; it speeds up the work between the judgments.